


A 502 Bad Gateway error appears when a request has reached the server, but one of the servers along its path did not receive a valid response from another. The page does not open, even though the visitor’s internet connection works and the domain is entered correctly. In most cases the cause is on the website’s side, which is why the message worries visitors and site owners alike.
Error code 502 does not name a specific fault, it only points to the place where the data exchange broke down. This article explains what 502 Bad Gateway means, how to tell a local failure from a server-side one, what a visitor can do, and in what order a site owner should look for the cause.
What the 502 Bad Gateway error means

502 Bad Gateway is an HTTP status code (status code 502) from the 5xx group, the group of server errors. The server acting as a gateway or proxy passed the request on, but received something invalid in return or faced a dropped connection before a valid response arrived. If the response did not arrive within the set time, the 504 Gateway Timeout code is usually applied instead.
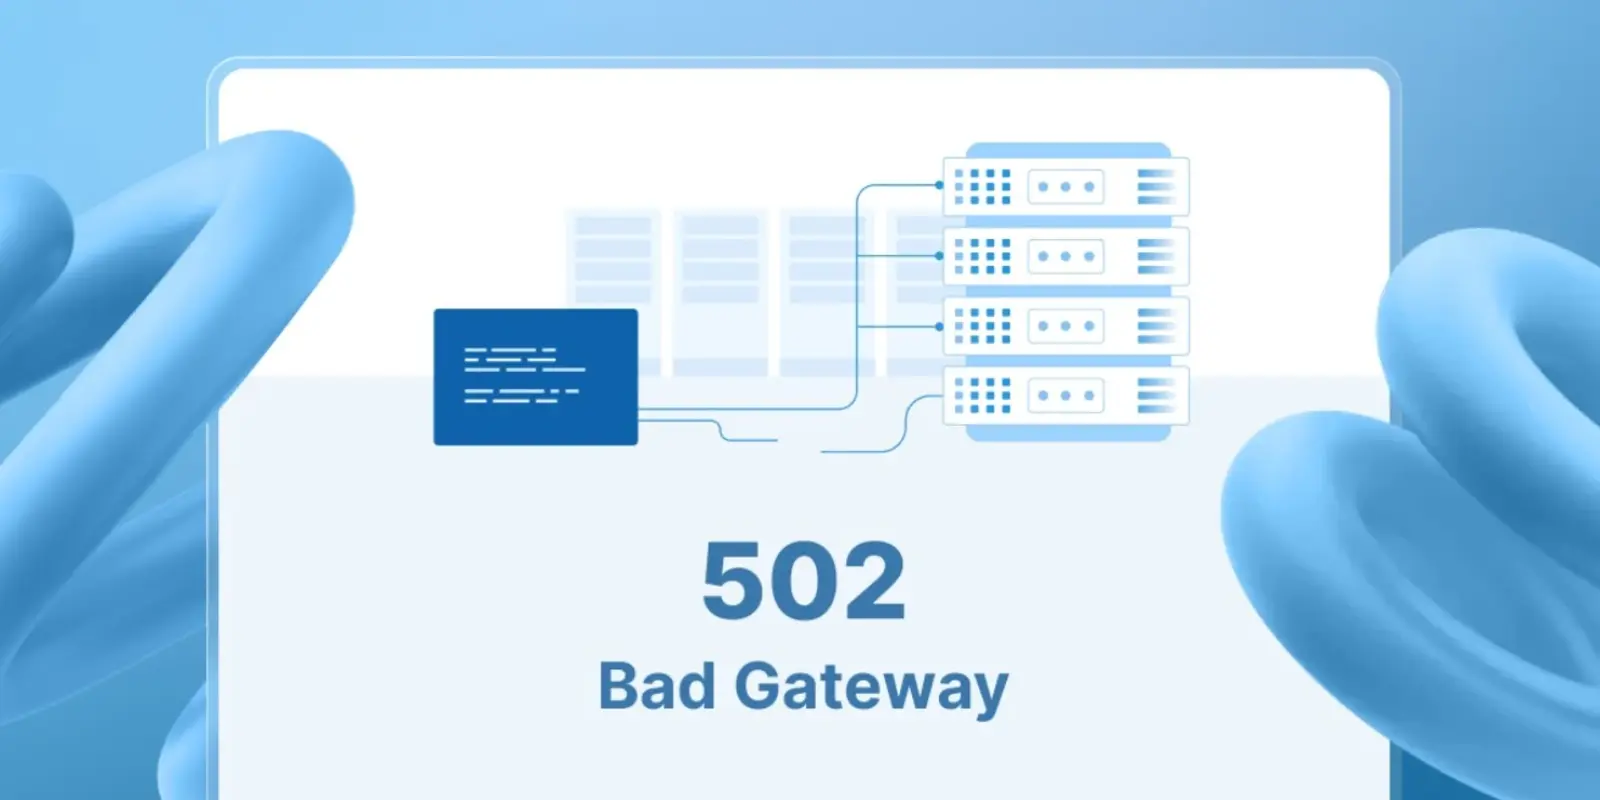
To understand the error, it helps to picture the path of a request. A modern website rarely consists of a single server. The application usually sits behind a reverse proxy, most often Nginx, which accepts connections from visitors and forwards requests to a handler: PHP-FPM, an application server running Node.js or Python, or another web server. A CDN, a load balancer and a firewall may stand even earlier in this chain.
A 502 error is returned by the gateway or proxy that could not get a valid response from the next server. That is why the text on the screen varies: “502 Bad Gateway nginx”, “502 Bad Gateway openresty”, “HTTP Error 502”, “502 Proxy Error”, “Error 502 Bad Gateway” or a branded CDN page. The page design may hint at which component generated the message, but it does not always identify the source of the fault unambiguously.
By itself, code 502 does not prove data loss, a hacked website or a domain problem, but it does not rule out related issues either. To establish the cause, the state of the servers, the network connections and the error logs need to be checked. Once the failure is fixed, the pages usually become available again.
How 502 differs from 500, 503 and 504 errors
Codes in the 5xx group indicate that the server could not fulfil the request because of an error or an unavailable component. They do not confirm that the request itself was valid. Each code, however, describes a different situation, and this determines where to look for the fault. Neighbouring codes are easiest to tell apart when they are placed side by side.
| Code | What happened | Where to look for the cause |
|---|---|---|
| 500 Internal Server Error | The server encountered an unexpected error while processing the request | Website code, configuration files, access permissions |
| 502 Bad Gateway | The proxy or gateway received an invalid response from the server it contacted | The link between the proxy and the handler, the state of the handler |
| 503 Service Unavailable | The server is temporarily unable to handle requests | Overload, maintenance, a stopped service |
| 504 Gateway Timeout | The proxy did not receive a response within the allotted time | Slow queries, timeouts, network delays |
In practice, 502 and 504 are the closest to each other, because both occur at the junction of two servers. The difference is that with 504 the handler simply did not respond in time, while with 502 the connection was refused, dropped, or the response turned out to be corrupted. If both codes alternate on a website, it is worth checking the state of the handler, the resources and the network connections: the causes may be related, but it is not necessarily a single failure.
Code 500, by contrast, is most often related to the application itself: an error in a script, an invalid directive or file permissions. At the same time, code 500 can also be generated by other components, so diagnostics should rely on the logs and not only on the error number. Reading the code accurately before any checks begin saves time and narrows the search.
Some services extend the standard list with their own codes. Cloudflare, for example, uses codes in the 52x group for situations where its node could not properly reach the site owner’s server: the connection was refused, the wait time ran out, the certificate failed validation. In meaning they are close to 502 and 504, but they name the stage at which the failure occurred more precisely.
Causes of the 502 error
The 502 error has several causes, and almost all of them come down to one thing: the request handler is unavailable, overloaded, or responds in a way the proxy does not expect. Less often the source is an intermediate service in front of the website that acts as a gateway itself.
The most common scenarios are worth looking at separately, because each requires its own checks and its own fix. Several causes often act at once: slow queries occupy the handler’s processes, memory runs out, and a failure that began as a minor delay turns into a complete outage.
Server overload
When the server lacks RAM or CPU time, the handler cannot accept new connections fast enough. The request queue fills up, and the proxy receives a refusal instead of a response. This happens during a sharp rise in traffic, heavy background jobs, aggressive bots crawling the site, or because of inefficient database queries.
A separate case is complete memory exhaustion. In this situation the operating system forcibly terminates the processes that consume the most, and PHP or database processes are often among them. To a visitor it looks like a sudden 502 error that disappears after the service restarts automatically and returns with the next load spike.
The source of the overload is often not the web server itself but the database. A query without the right index or a selection from a large table blocks a handler process for a long time, and fewer free processes remain with each new visitor. From the outside the picture is the same, but adding memory will not help until the slow query is found and fixed.
PHP-FPM or application server failure
The handler may be stopped, frozen or fully occupied. In PHP-FPM the number of simultaneous processes is limited by the pm.max_children parameter. When all processes are busy with slow requests, new requests wait for a free process. Depending on the configuration and the nature of the failure, this may end with 502, 504 or another code.
A process may also crash while a script is running: because of an extension failure, a shortage of system memory, or forced termination by the request_terminate_timeout parameter. Simply exceeding the PHP memory_limit does not necessarily terminate the process and does not by itself mean a 502. The connection breaks before the response is formed, and the proxy receives truncated data. Application servers running Node.js, Python or Java behave similarly if the process has crashed and was not restarted.
Another source of hangs is external services. A page may be waiting for a response from a payment system, a CRM, a delivery service or another API. If such a request is made while the page is being generated and has no time limit of its own, the handler process stays busy until the external service responds. Several such requests at once can occupy all free processes.
A typical sign of this scenario is that restarting the service helps, but not for long. The website works for several hours or days, after which the error returns. This means the processes gradually accumulate memory or hang on a certain type of request. Limiting the number of requests after which a process restarts smooths the situation temporarily, but the real cause still has to be found in the code or in the slow query log.
Nginx configuration and timeouts
The error may be built into the settings themselves. The proxy contacts the wrong address or port, or the path to the PHP-FPM socket changed after a PHP version update while the configuration was left as it was. Response header buffers that are too small lead to the same result: if the application sends large cookies or long headers, Nginx rejects such a response as invalid.
With timeouts the situation is less obvious. When Nginx itself did not receive a response in time, it returns 504, not 502. However, if the execution time is limited on the handler’s side, the handler terminates the process and drops the connection, and then exactly 502 occurs. That is why increasing timeouts does not always help: it only hides the slow request and keeps the processes occupied for longer.
Protocol mismatch belongs to the same group. If the proxy contacts the handler over HTTPS while the handler expects plain HTTP, a protocol error occurs. Problems with the internal server’s certificate can also break the connection when TLS verification is configured. The handler itself works properly, and without looking at the proxy log it is hard to understand the reason for the refusal.
A setup in which the Apache and Nginx web servers work together needs a separate check: one accepts requests, the other processes them, and a configuration error in either of them produces the same 502 code.
CDN, firewall and DDoS protection
If the website is connected to a content delivery network, a CDN node may be one of the intermediate gateways. It contacts the server where the website is hosted and, if the attempt fails, shows a page with the 502 code itself. Some CDNs provide additional diagnostics, but the error page does not always identify the faulty component precisely. This helps to understand whom to contact.
It also happens that the server is running but does not let CDN nodes in. A firewall or protection system treats a large number of requests from the same addresses as suspicious activity and blocks them. A real attack has a similar effect: during a DDoS attack the handler is flooded with requests, and legitimate visitors see 502. Filtering rules therefore need to be aligned with the way traffic reaches the website.
One more cause is related to addresses. After a website is moved to another server, the old IP address may remain in the CDN or load balancer settings. The intermediate service keeps contacting the place where the website no longer exists and receives a refusal. The same happens when a DNS record has been updated but part of the network still uses the previous value from the cache.
Scope of the 502 error
The first thing to find out is whether all visitors see the error or only one. To do this, it is enough to open the website from another device and through another network, for example mobile data. If the page opens only from another network, it is worth checking the DNS cache, VPN, proxy and routing. The difference may also be related to the CDN, a regional node or filtering rules on the server.
If the website is unavailable from several independent networks, a problem on the server or in the intermediate infrastructure becomes more likely. Here it is important to clarify whether it affects the whole resource or individual pages. An error only on heavy pages, such as search, a catalogue with filters or a report export, points to slow queries. An error on all addresses at once more often means a stopped handler or a configuration failure.
It is also useful to record the nature of the failure. A constant error that appeared after changes on the server is usually related to the settings. An error that comes in waves during peak hours points to a lack of resources. The exact time of the first occurrence will later help to find the right log entries and match them with updates and load spikes.
A site owner should additionally check the server response without a browser, for example with the curl -I command and the page address. It shows the status code and headers, which sometimes help to identify an intermediate component but do not guarantee that the source of the failure will be established. For addresses that do not support the HEAD method, a regular GET request should be checked. If the website is hosted with a provider, it is also useful to look at the provider’s service status page and maintenance notices, so as not to search for a fault where there is none.
What a user can do about a 502 error
A visitor cannot fix a failure on someone else’s server, but can make sure the problem is not on their side. The check takes a few minutes and requires no technical knowledge. It is best to start with the simplest steps, gradually ruling out local causes.
- Refresh the page after a minute or two. Short failures during service restarts pass on their own.
- Open the website in incognito mode or in another browser. This rules out the cache, cookies and extensions.
- Clear the cache and cookies for this website if the page opens in a private window.
- Turn off the VPN or proxy and try another network.
- Clear the DNS cache if only this website fails to open and only on your device. On Windows, run ipconfig /flushdns in the command prompt; on macOS, run sudo killall -HUP mDNSResponder in the terminal.
- Restart the router and check whether other websites open.
If none of the steps helped and the website is also unavailable from other networks, the problem is likely on the side of the service or its network infrastructure. All that remains is to wait or to notify the owner through social media or email, giving the page address and the time the error appeared.
On a phone the steps are the same, only shorter. Refresh the page, switch from Wi-Fi to mobile data or back, open the website in another browser and clear the browser data for this website. If the error is shown by an app and not a website, restarting the app helps, and when the failure is widespread, all that remains is to wait until the service is restored.
Payment and order forms deserve a separate mention. If the error appeared right after a form was submitted, the action should not be repeated several times in a row. The request may have been processed even though the response did not arrive. It is better to check the email, the account or the bank statement and only then repeat the operation.
Diagnosing a 502 error as a site owner
When a 502 error on a website does not go away by itself, the owner or administrator needs a sequence that leads from the symptom to the cause. Restarting the services often brings the website back, but without finding the cause the error returns.
That is why it is advisable to save the system state before a restart: log entries, load figures and a list of recent changes. It is also worth making sure the provider has no scheduled maintenance or general outage: if all websites on the server are unavailable, code changes will not help. After a restart part of this information disappears, and next time the search will have to start from scratch. It is convenient to check in four directions, moving from the most precise source to the more general ones.
Nginx and PHP-FPM logs
The most precise answer comes from the server logs. In a typical configuration Nginx writes errors to /var/log/nginx/error.log, while the location of the PHP-FPM log depends on the distribution and the PHP version. Look for entries from the time when visitors saw the error, and pay attention to the word upstream, which Nginx uses for the handler server.
The wording of the entry points directly to the nature of the failure. The line “connect() failed (111: Connection refused)” means the handler is not accepting connections: it is stopped or listening on another address. The entry “upstream prematurely closed connection” indicates that the process terminated while handling the request. The message “upstream sent too big header” points to buffers that are too small.
In the PHP-FPM log it is worth looking for warnings that the pm.max_children limit has been reached and for entries about processes terminated by a signal. If there are no such entries but processes disappear, the kernel system log should be reviewed: it records cases of processes being forcibly terminated because of a memory shortage. If the database is suspected, the slow query log will help: it shows the operations that take the longest.
On WordPress websites the system’s own log provides additional information. It is enabled in the wp-config.php file with the WP_DEBUG and WP_DEBUG_LOG parameters, while the WP_DEBUG_DISPLAY parameter set to false keeps the messages off the pages. The entries are saved to the debug.log file in the wp-content folder and can help to identify the problematic component. The log should be protected from public access, and detailed debugging should be turned off after the check. Not every PHP error causes a 502.
It is useful to compare the error log with the access log. It shows which addresses received a 502 response, how many such requests there were and where they came from. A concentration of errors on certain URLs may point to a specific operation or module, while widespread failures point to a shared infrastructure component. The final conclusion is made after the logs have been compared.
Server resources under load
The second direction is the state of the server itself. The top or htop utilities show CPU load and the processes that consume the most, the free -m command shows the state of RAM and swap, and df -h shows free disk space. A full disk is often a non-obvious cause: services cannot write temporary files or sessions and terminate with an error.
It is worth looking not only at the current values but also at the trend. If memory runs out gradually over several hours, a leak in the application is likely. If the load jumps at a certain time, the cause should be sought in scheduled jobs, backups or bots crawling the site, which is clearly visible in the access log.
The results make it clear what exactly is lacking. Sometimes it is enough to align the number of PHP-FPM processes with the available memory so that the server does not take on more than it can handle. In other cases database queries need to be optimised or caching added. If an optimised application consistently runs into the available resources, it makes sense to review the server configuration.
Recent changes on the website
The third direction is everything that changed shortly before the error appeared. This includes updates of PHP, the CMS, plugins and themes, edits to the Nginx configuration, new firewall rules, and connecting or reconfiguring a CDN. After a PHP version update, for example, the socket path often changes while the old one remains in the web server configuration.
The nginx -t command checks whether the Nginx configuration is valid, and systemctl status shows the state of the services. If the configuration is valid and all services are running, attention shifts to the website itself: updated plugins, themes and CMS modules.
To check the influence of the CDN, the service is temporarily switched to a mode without proxying, or the server is contacted directly, bypassing the delivery network. If the website responds directly, the CDN settings, access rules, TLS and routing are checked. Direct access should be carried out in a controlled way, without opening the origin server to outside traffic. When the cause is found in a recent change, the fastest way is to roll it back and repeat it only after testing on a staging copy.
CMS plugins, themes and modules
On websites with a ready-made CMS, the cause is often an extension that hangs or ends with a critical error after an update. In WordPress, the time of the failure is first matched with updates and PHP logs. If a plugin is suspected, it is temporarily deactivated through the admin panel or WP-CLI, and if there is no access, its folder is carefully renamed after a backup has been made. Deactivating plugins in bulk and changing the theme on a live website can break functionality, so such actions are best tested on a staging copy.
Next, the PHP error log is reviewed, the memory limit is checked and the object cache is cleared. Once the website is working, the extensions are returned one by one, and the page is refreshed after each step. The module after whose activation the error returned is updated, replaced with an alternative or rolled back to the previous version.
In OpenCart, attention is paid to modifications, the system cache, filter modules, product import and synchronisation with a CRM or warehouse. If the 502 error appears specifically during an import, the operation should be moved to background processing or the file split into parts. Raising all limits at once is not advisable: first the component that creates the excessive load has to be found.
Impact of the 502 error on SEO
Search engine crawlers receive the same code as visitors. A single short failure will not necessarily affect search visibility: having encountered a server error, the crawler may retry later. When 5xx errors occur often, the search engine temporarily reduces the crawl rate so as not to put additional load on the server.
The risk appears when the failure lasts a long time or recurs regularly. Pages that consistently return a server error may eventually be removed from the index, and new content reaches search with a delay. The crawl state is visible in Google Search Console reports, where server errors are placed in a separate category.
For scheduled maintenance there is a more appropriate way to report unavailability. During short planned work the server can be configured to respond with 503 and the Retry-After header, which indicates the recommended time for a retry. Prolonged unavailability harms crawling and indexing even with code 503. This way the search engine receives a clear signal that the interruption is temporary and not a website fault.
Besides search, the failure affects advertising and visitor behaviour. Ads keep sending people to a page that does not open, and the budget is spent with no result. During a prolonged outage it therefore makes sense to pause advertising campaigns, and after the website is restored, to check that the landing pages respond correctly.
Preventing the 502 error
Failures cannot be ruled out completely, but their likelihood and duration can be reduced noticeably. Most measures concern not a single setting but the way the server is managed: monitoring, spare capacity and caution with changes.
- Monitoring. External availability checks and 5xx error alerts make it possible to learn about a failure before visitors do.
- Spare resources. The server should withstand peak load, not just the average, and have a memory reserve for background jobs.
- Aligned limits. The number of handler processes, the timeouts and the proxy buffers should match each other and the amount of memory.
- Caching. Ready-made pages and the results of heavy queries take part of the load off the handler.
- Change control. Updates and configuration edits are first tested on a staging copy and have a rollback plan.
- Traffic filtering. Limits for bots and protection against attacks keep outside requests from exhausting resources.
- Limits for external services. Requests to third-party APIs have their own timeout and, where possible, run in the background.
- Checks before a peak. Load testing before an advertising campaign or a sale determines the server’s limit in advance.
The most valuable item on this list is monitoring of website availability and server performance. It records not only the failure itself but also the response time, whose changes reveal an approaching problem in advance.
Changing the server is not always necessary. If the error was caused by a single faulty plugin, a wrong socket path after a PHP update, a CDN rule or a one-off failure of an external service, moving will change nothing. The specific cause should be fixed first, and only then is it worth assessing whether the server has enough capacity.
If the website regularly runs into the limits of its plan, has predictable traffic peaks or needs its own handler settings, it is worth considering a move to a server with guaranteed resources. Hostpark offers SSD VDS in Poland on Atman infrastructure with KVM virtualisation. This format makes it possible to select resources for the needs of the application and to administer the server in line with the chosen configuration. For architectures with several nodes, load balancing may be useful, and it requires separate design. For network filtering, a separate managed service, Atman Firewall, is available in the Atman infrastructure; it is not an automatic part of a VDS and does not replace fixing the causes of the 502 error.
Conclusion
A 502 Bad Gateway error means that a proxy or gateway did not receive a valid response from the server it passed the request to. For a visitor it is a reason to check the browser and the network and come back to the website later. For a site owner it is a signal that the request handler is unavailable, overloaded or incorrectly linked to the web server.
There is one reliable way to fix it: establish the scope, read the logs, assess the resources and check recent changes. Restarting the services sometimes restores operation temporarily but does not necessarily remove the cause. The Nginx and handler logs help to narrow the search, and the findings should be compared with metrics and configuration changes.
When the error recurs under load, the solution is to optimise the application or move to a server with more spare capacity, while constant monitoring helps to notice such situations in time.